Tables: Exercise-1
Overview:
| Questions and Answers Type: | MCQ (Multiple Choice Questions). |
| Main Topic: | Data Interpretation. |
| Data Interpretation Sub-topic: | Tables Questions and Answers. |
| Number of Questions: | 5 Questions with Solutions. |
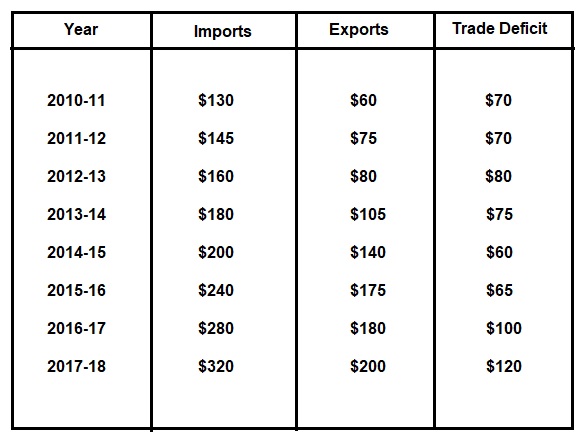
Directions: The figure for a country's foreign trade for the years 2010-11 to 2017-18 are given in the following table. Study the table carefully and answer the questions given below.
A country's foreign trade (Dollars in billion)
- Which of the following is not increasing every year?
- Imports
- Exports
- Trade Deficit
- All of these
Answer: (c) Trade DeficitSolution: No Description.
- Find in which year the ratio of the imports to exports is maximum?
- 2010-11
- 2012-13
- 2016-17
- 2017-18
Answer: (a) 2010-11Solution: We have to calculate the ratio only for four years according to options. for 2010-11 $$ = \frac{130}{60} = 2.16 $$ for 2012-13 $$ = \frac{160}{80} = 2 $$ for 2016-17 $$ = \frac{280}{180} = 1.55 $$ for 2017-18 $$ = \frac{320}{200} = 1.6 $$ Hence, it is clear that in the year 2010-11, the ratio of imports to exports is the maximum.
- Find in which year the increase in exports is maximum in percentage?
- 2014-15
- 2015-16
- 2016-17
- 2017-18
Answer: (b) 2015-16Solution: We have to calculate only for four years according to options. for 2014-15 $$ = \frac{200 - 180}{180} \times 100 $$ $$ = 11.11 \ \% $$ for 2015-16 $$ = \frac{240 - 200}{200} \times 100 $$ $$ = 20 \ \% $$ for 2016-17 $$ = \frac{280 - 240}{240} \times 100 $$ $$ = 16.66 \ \% $$ for 2017-18 $$ = \frac{320 - 280}{280} \times 100 $$ $$ = 14.28 \ \% $$ Hence, it is clear that in the year 2015-16, the increase in exports is the maximum.
- Find the total trade deficit for the last three years?
- $255 Billion
- $258 Billion
- $265 Billion
- $285 Billion
Answer: (d) $285 BillionSolution: Trade deficit for the last three years, $$ = 120 + 100 + 165 $$ $$ = $285 \ Billion $$
- Find in which year the difference between imports and exports is maximum?
- 2011-12
- 2012-13
- 2016-17
- 2017-18
Answer: (d) 2017-18Solution: The difference between imports and exports is called trade deficit, so it is clear from the table that in the year 2017-18, it is maximum.