Tables: Exercise-6
Overview:
| Questions and Answers Type: | MCQ (Multiple Choice Questions). |
| Main Topic: | Data Interpretation. |
| Data Interpretation Sub-topic: | Tables Questions and Answers. |
| Number of Questions: | 5 Questions with Solutions. |
Directions: Study the following table carefully and answer the questions given below it.
The number of students appeared and qualified in an exam (in million) from 5 different provinces in 6 different years.
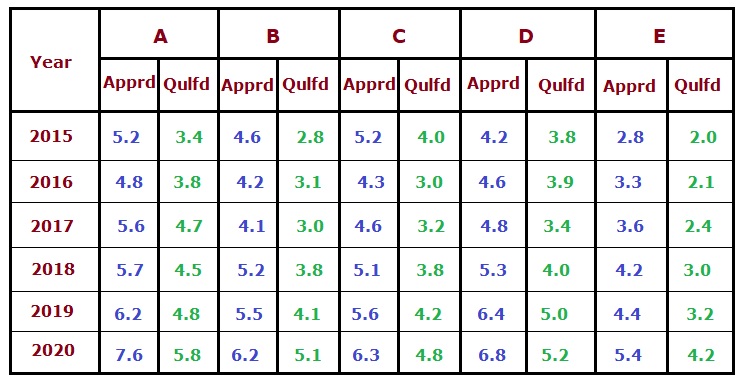
- In which year the difference between the appeared students and the qualified students from province B was maximum?
- 2015
- 2016
- 2017
- 2018
Answer: (a) 2015Solution: The difference between the appeared students and qualified students from province B in different years. $$ 2015 = 4.6 - 2.8 = 1.8 $$ $$ 2016 = 4.2 - 3.1 = 1.1 $$ $$ 2017 = 4.1 - 3.0 = 1.1 $$ $$ 2018 = 5.2 - 3.8 = 1.4 $$ $$ 2019 = 5.5 - 4.1 = 1.4 $$ $$ 2020 = 6.2 - 5.1 = 1.1 $$ Hence in 2015 the difference between the appeared students and the qualified students from province B was maximum.
- From which province was the total number of students, who qualified for the exam, the third-lowest in the year 2019 and 2020 together?
- A
- B
- C
- D
Answer: (b) BSolution: Qualified students from different provinces in the year 2019 and 2020 together. $$ A = 4.8 + 5.8 = 10.6 $$ $$ B = 4.1 + 5.1 = 9.2 $$ $$ C = 4.2 + 4.8 = 9.0 $$ $$ D = 5.0 + 5.2 = 10.2 $$ $$ E = 3.2 + 4.2 = 7.4 $$ Hence the total number of students who qualified for the exam, the third-lowest in the year 2019 and 2020 together was from province B.
- What is the average number of students, appeared from province C over all the years together?
- 5.18 million
- 5.35 million
- 5.41 million
- 5.51 million
Answer: (a) 5.18 millionSolution: The total number of students appeared for the exam from province C over all the years together = 31.1 million.Required average $$ = \frac{31.1}{6} $$ $$ = 5.18 \ million $$
- What was the ratio of the number of students who appeared from province A in the year 2019 to the number of students qualified from province E in the year 2017?
- 24 : 7
- 28 : 9
- 29 : 11
- 31 : 12
Answer: (d) 31 : 12Solution: Required ratio $$ = \frac{6.2}{2.4} $$ $$ = 31 : 12 $$
- The number of students who qualified for the exam from province B in the year 2016 was approximately what percent of the number of students who appeared from province C in the year 2017?
- 58 %
- 62 %
- 67 %
- 72 %
Answer: (c) 67 %Solution: Required percentage $$ = \left[\frac{3.1}{4.6} \times 100\right] \ \% $$ $$ = 67.39 \ \% $$ $$ \approx 67 \ \% $$