Line Graph: Exercise-7
Overview:
| Questions and Answers Type: | MCQ (Multiple Choice Questions). |
| Main Topic: | Data Interpretation. |
| Data Interpretation Sub-topic: | Line Graph Questions and Answers. |
| Number of Questions: | 5 Questions with Solutions. |
Directions: Study the following graph carefully and answer the questions given below it.
The total number of students enrolled in three different schools in various years.
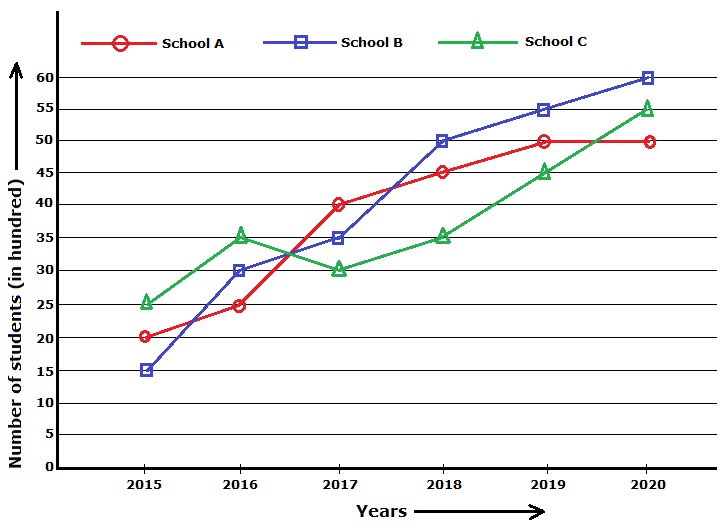
- What is the ratio between the number of students enrolled in school A in the year 2017 and the total number of students in school B and school C together in the same year?
- 9 : 14
- 8 : 13
- 5 : 11
- 4 : 9
Answer: (b) 8 : 13Solution: The total number of students enrolled in school A in the year 2017 \(= 4000\)The total number of students enrolled in school B and C together in the year 2017 \(= 3500 + 3000\) \(= 6500\)Required ratio $$ = \frac{4000}{6500} $$ $$ = \frac{8}{13} $$ $$ = 8 : 13 $$
- What is the average number of students enrolled in the year 2020 in all three schools together?
- 5500
- 5800
- 6000
- 6200
Answer: (a) 5500Solution: The Total number of students enrolled in the year 2020 in all the schools together. $$ = 6000 + 5500 + 5000 $$ $$ = 16500 $$ Required Average $$ = \frac{16500}{3} $$ $$ = 5500 $$
- The total number of students enrolled in all three schools in the year 2018 is what percent of the total number of students enrolled in all three schools in the year 2019?
- 77.37 %
- 78.53 %
- 82.22 %
- 86.67 %
Answer: (d) 86.67 %Solution: The total number of students enrolled in all three schools in the year 2018. $$ = 4500 + 5000 + 3500 $$ $$ = 13000 $$ The total number of students enrolled in all three schools in the year 2019. $$ = 4500 + 5000 + 5500 $$ $$ = 15000 $$ Required percentage $$ = \left[\frac{13000}{15000} \times 100\right] \ \% $$ $$ = 86.67 \ \% $$
- In which year the total number of students enrolled in all three schools together was the third highest?
- 2016
- 2017
- 2018
- 2019
Answer: (c) 2018Solution: The total number of students enrolled in all three schools together in various years. $$ 2015 = 1500 + 2000 + 2500 $$ $$ = 6,000 $$ $$ 2016 = 2500 + 3000 + 3500 $$ $$ = 9,000 $$ $$ 2017 = 3000 + 3500 + 4000 $$ $$ = 10,500 $$ $$ 2018 = 3500 + 4500 + 5000 $$ $$ = 13,000 $$ $$ 2019 = 4500 + 5000 + 5500 $$ $$ = 15,000 $$ $$ 2020 = 5000 + 5500 + 6000 $$ $$ = 16,500 $$ Hence in the year 2018, the total number of students enrolled in all three schools was the third-highest.
- The total number of students enrolled in school B in the year 2018 is what percent of the total number of students enrolled in school A in the year 2020?
- 110 %
- 100 %
- 90 %
- 75 5
Answer: (b) 100 %Solution: Required percentage $$ = \left[\frac{5000}{5000} \times 100\right] \ \% $$ $$ = 100 \ \% $$