Line Graph: Exercise-1
Overview:
| Questions and Answers Type: | MCQ (Multiple Choice Questions). |
| Main Topic: | Data Interpretation. |
| Data Interpretation Sub-topic: | Line Graph Questions and Answers. |
| Number of Questions: | 5 Questions with Solutions. |
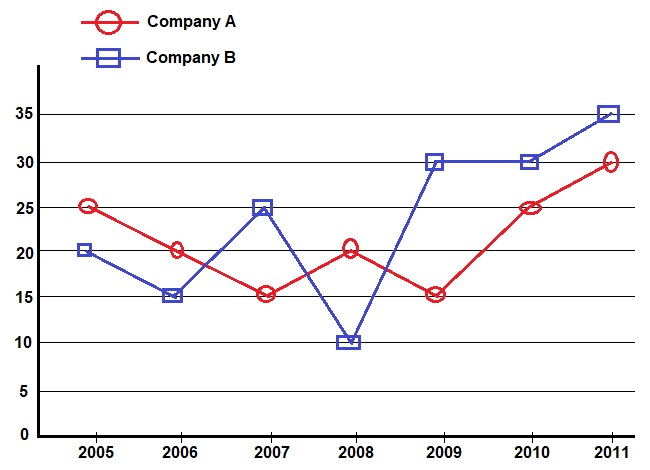
Directions: Study the following graph carefully and answer the questions given below it.
Percent profit earned by two companies over the given years.
- If the expenditure of the company B in 2009 was Rs.150 lacs, what was the income of the company in that year?
- Rs.155 lacs
- Rs.175 lacs
- Rs.195 lacs
- Rs.210 lacs
Answer: (c) Rs.195 lacsSolution: Income of the company B in the year 2009, $$ = 150 \times \frac{130}{100} $$ $$ = Rs.195 \ lacs $$
- If the income of the company A in the year 2010 was Rs.900 lacs, what was the expenditure of the company in that year?
- Rs.720 lacs
- Rs.725 lacs
- Rs.730 lacs
- Rs.732 lacs
Answer: (a) Rs.720 lacsSolution: Expenditure of the comapny A in the year 2010, $$ = 900 \times \frac{100}{125} $$ $$ = Rs.720 \ lacs $$
- If the income of the company B in the year 2007 was Rs.250 lacs, what was its profit in that year?
- Rs62.5 lacs
- Rs65.7 lacs
- Rs68.2 lacs
- Rs70.3 lacs
Answer: (a) Rs62.5 lacsSolution: Let the profit of the company B in the yaer 2007 = Rs.X lacsThen, $$ \frac{X}{250} \times 100 = 25 $$ $$ X = \frac{125}{2} $$ $$ X = Rs \ 62.5 \ lacs $$
- If the income of two companies in the year 2006 were equal, what was the ratio of their expenditure?
- 25:26
- 24:25
- 23:24
- 22:23
Answer: (c) 23:24Solution: Required ratio, $$ = \frac{100}{120} \times \frac{115}{100} $$ $$ = \frac{115}{120} $$ $$ = 23 : 24 $$
- What is the percent increase in profit for company A from the year 2009 to 2011?
- 140%
- 120%
- 110%
- 100%
Answer: (d) 100%Solution: Required percent increase, $$ = \frac{30 - 15}{15} \times 100 $$ $$ = 100 \ \% $$