Line Graph: Exercise-3
Overview:
| Questions and Answers Type: | MCQ (Multiple Choice Questions). |
| Main Topic: | Data Interpretation. |
| Data Interpretation Sub-topic: | Line Graph Questions and Answers. |
| Number of Questions: | 5 Questions with Solutions. |
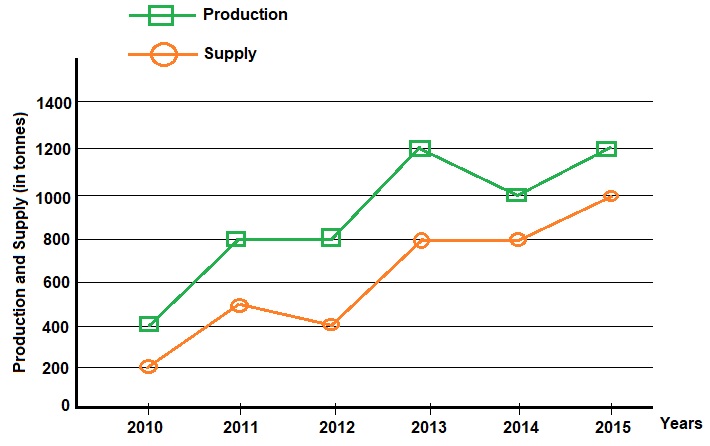
Directions: Study the following graph carefully and answer the questions given below it.
The graph given below represents the production and supply (in tonnes) of a company during the years 2010 to 2015.
- What is the approximate percentage increase in the production of the company from the year 2010 to the production of the company in the year 2011?
- 120%
- 100%
- 80%
- 60%
Answer: (b) 100%Solution: Required percentage, $$ = \frac{800 - 400}{400} \times 100 $$ $$ = 100 \ \% $$
- The supply of the company in the year 2013 was approximately what percent of the production of the company in the same year?
- 67%
- 62%
- 58%
- 56%
Answer: (a) 67%Solution: Required percentage, $$ = \frac{800}{1200} \times 100 $$ $$ = 66.67 \approx 67 \ \% $$
- What is the average production of the company from the year 2010 to the year 2015?
- 900 Tonnes
- 800 Tonnes
- 600 Tonnes
- 500 Tonnes
Answer: (a) 900 TonnesSolution: Required Average, $$ = \frac{5400}{6} = 900 \ Tonnes $$
- What is the respective ratio of the total production and total supply of the company from the year 2010 to the year 2015?
- 32:25
- 46:33
- 54:37
- 56:43
Answer: (c) 54:37Solution: Total production during all the years together = 5400 tonnesTotal supply during all the years together = 3700 tonnesHence the required ratio, $$ = 5400 : 3700 $$ $$ = 54 : 37 $$
- What is the respective ratio of the production of the company in the year 2014 to the production of the company in the year 2015?
- 3:2
- 2:3
- 6:5
- 5:6
Answer: (d) 5:6Solution: Required ratio, $$ = 1000 : 1200 $$ $$ = 5 : 6 $$