Line Graph: Exercise-5
Overview:
| Questions and Answers Type: | MCQ (Multiple Choice Questions). |
| Main Topic: | Data Interpretation. |
| Data Interpretation Sub-topic: | Line Graph Questions and Answers. |
| Number of Questions: | 5 Questions with Solutions. |
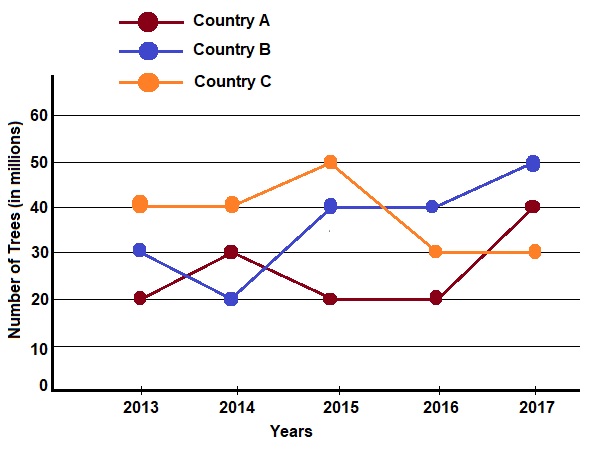
Directions: Study the following graph carefully and answer the questions given below it.
Number of trees planted by the three different countries over the years.
- In which year was the total number of trees planted by all the countries together highest?
- 2014
- 2015
- 2016
- 2017
Answer: (d) 2017Solution: Number of trees planted by all the countries together over the years.In 2013, $$ = 20 + 30 + 40 $$ $$ = 90 \ Millions $$ In 2014, $$ = 30 + 20 + 40 $$ $$ = 90 \ Millions $$ In 2015, $$ = 20 + 40 + 50 $$ $$ = 110 \ Millions $$ In 2016, $$ = 20 + 40 + 30 $$ $$ = 90 \ Millions $$ In 2017, $$ = 40 + 50 + 30 $$ $$ = 120 \ Millions $$ Hence, in the year 2017, the total number of trees planted by all the countries together was highest.
- What was the difference between the trees planted by the country B in the year 2016 and the number of trees planted by the country C in the year 2017?
- 10 Millions
- 20 Millions
- 30 Millions
- 40 Millions
Answer: (a) 10 MillionsSolution: Required difference, $$ = 40 - 30 $$ $$ = 10 \ Millions $$
- What was the average number of trees planted in the year 2015 by all the countries together?
- 36.67 Millions
- 32.25 Millions
- 30.15 Millions
- 28.63 Millions
Answer: (a) 36.67 MillionsSolution: Average number of trees planted by all the countries together in the year 2015, $$ = \frac{20 + 40 + 50}{3} $$ $$ = 36.67 \ Millions $$
- Total number of trees planted by the countries B and C together in the year 2013 was approximately what percent of the total number of trees planted by the countries B and C together in the year 2015
- 67.67%
- 77.78%
- 86.56%
- 62.32%
Answer: (b) 77.78%Solution: Required percentage, $$ = \frac{(30 + 40)}{(40 + 50)} \times 100 $$ $$ = 77.78 \ \% $$
- What was the respective ratio between the number of trees planted by the country A in the year 2016, the number of trees planted by the country B in the year 2015, and the number of trees planted by the country C in the year 2017?
- 4:3:2
- 3:2:4
- 2:4:3
- 3:4:2
Answer: (c) 2:4:3Solution: Required ratio, $$ = 20 : 40 : 30 $$ $$ = 2 : 4 : 3 $$