Bar Diagrams: Exercise-9
Overview:
| Questions and Answers Type: | MCQ (Multiple Choice Questions). |
| Main Topic: | Data Interpretation. |
| Data Interpretation Sub-topic: | Bar Graph Questions and Answers. |
| Number of Questions: | 5 Questions with Solutions. |
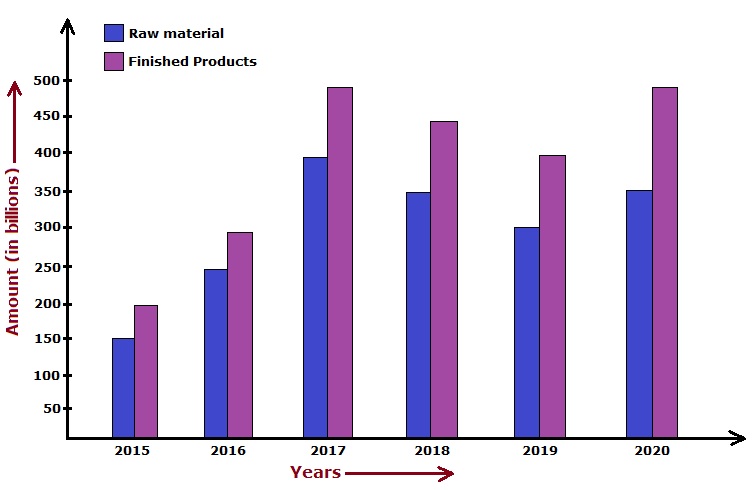
Directions: Study the following bar diagram carefully and answer the questions given below it.
The amount invested by a company is raw materials (in billion) and the value of finished products sold by the company (in billion).
- Find the year with the maximum percentage increase in the amount invested in raw materials as compared to the previous year?
- 2016
- 2017
- 2019
- 2020
Answer: (a) 2016Solution: Percentage increase in the amount invested in raw materials as compared to the previous year. $$ 2016 = \left[\frac{250 - 150}{150} \times 100\right] \ \% $$ $$ = \left[\frac{100}{150} \times 100\right] \ \% $$ $$ = 66.67 \ \% $$ $$ 2017 = \left[\frac{400 - 250}{250} \times 100\right] \ \% $$ $$ = \left[\frac{150}{250} \times 100\right] \ \% $$ $$ = 60 \ \% $$ $$ 2020 = \left[\frac{350 - 300}{300} \times 100\right] \ \% $$ $$ = \left[\frac{50}{300} \times 100\right] \ \% $$ $$ = 16.67 \ \% $$ Hence the maximum percentage increase in the amount invested in raw materials as compared to the previous year was in 2016.
- What is the difference between the average amount invested in raw materials during 2016-18 to the average value of sales of finished products during the same period?
- 68.66 billion
- 72.22 billion
- 83.33 billion
- 94.44 billion
Answer: (c) 83.33 billionSolution: The average amount invested in raw materials during 2016-18. $$ = \frac{1}{3} \ (250 + 400 + 350) $$ $$ = \frac{1}{3} \ (1000) $$ $$ = 333.34 \ billion $$ The average value of sales of finished products during 2016-18. $$ = \frac{1}{3} \ (300 + 500 + 450) $$ $$ = \frac{1}{3} \ (1250) $$ $$ = 416.67 \ billion $$ Required difference $$ = 416.67 - 333.34 $$ $$ = 83.33 \ billion $$
- The amount invested in raw materials in 2017 was approximately what percent of the average amount of sales during the years 2015-16?
- 50 %
- 60 %
- 70 %
- 80 %
Answer: (d) 80 %Solution: Required percentage $$ = \left[\frac{400}{200 + 300} \times 100\right] \ \% $$ $$ = \left[\frac{400}{500} \times 100\right] \ \% $$ $$ = 80 \ \% $$
- Find the year with the maximum difference between the amount invested in raw materials and the value of sales of the finished products?
- 2017
- 2018
- 2019
- 2020
Answer: (d) 2020Solution: Difference between the amount invested in raw materials and the value of sales of the finished products during various years. $$ 2015 = 200 - 150 $$ $$ = 50 \ billion $$ $$ 2016 = 300 - 250 $$ $$ = 50 \ billion $$ $$ 2017 = 500 - 400 $$ $$ = 100 \ billion $$ $$ 2018 = 450 - 350 $$ $$ = 100 \ billion $$ $$ 2019 = 400 - 300 $$ $$ = 100 \ billion $$ $$ 2020 = 500 - 350 $$ $$ = 150 \ billion $$ Hence the difference was maximum during the year 2020 (150 billion).
- In which year, the percentage change as compared to the previous year in the value of sales was maximum?
- 2016
- 2017
- 2018
- 2019
Answer: (b) 2017Solution: Percentage change as compared to the previous year in the value of sales over the years. $$ 2016 = \left[\frac{300 - 200}{200} \times 100\right] \ \% $$ $$ = 50 \ \% $$ $$ 2017 = \left[\frac{500 - 300}{300} \times 100\right] \ \% $$ $$ = 66.67 \ \% $$ $$ 2018 = \left[\frac{450 - 500}{500} \times 100\right] \ \% $$ $$ = -10 \ \% $$ $$ 2019 = \left[\frac{400 - 450}{450} \times 100\right] \ \% $$ $$ = -11.12 \ \% $$ $$ 2020 = \left[\frac{500 - 400}{400} \times 100\right] \ \% $$ $$ = 25 \ \% $$ Hence the maximum change in the value of sales was in the year 2017 (66.67 %).