Bar Diagrams: Exercise-5
Overview:
| Questions and Answers Type: | MCQ (Multiple Choice Questions). |
| Main Topic: | Data Interpretation. |
| Data Interpretation Sub-topic: | Bar Graph Questions and Answers. |
| Number of Questions: | 5 Questions with Solutions. |
Directions: Study the following bar diagram carefully and answer the questions given below it.
Income of three families A, B, and C on four different months.
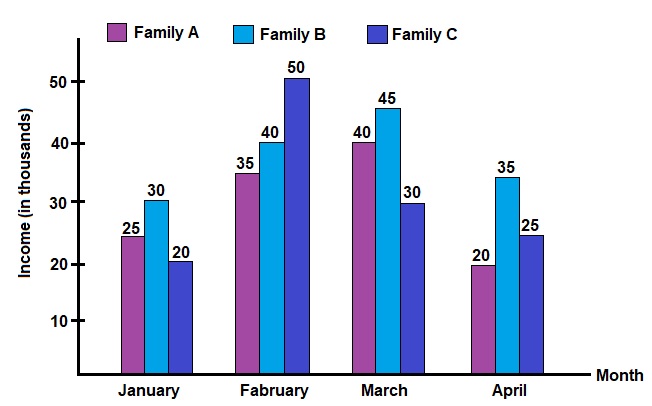
- Find the average income of family B over all the four months together?
- 32.5 Thousands
- 37.5 Thousands
- 41.5 Thousands
- 42.5 Thousands
Answer: (b) 37.5 ThousandsSolution: Average income of family B over all the four months together, $$ = \frac{30 + 40 + 45 + 35}{4} $$ $$ = 37.5 \ Thousands $$
- What is the total amount earned by family A and B together on January and April together?
- 100 Thousands
- 110 Thousands
- 120 Thousands
- 130 Thousands
Answer: (b) 110 ThousandsSolution: Total amount earned by family A and B together on January and April, $$ = 25 + 30 + 20 + 35 $$ $$ = 110 \ Thousands $$
- Family A donated their January month income to family C. What was the total income of family C on the month January after the donation of family A?
- 45 Thousands
- 48 Thousands
- 52 Thousands
- 56 Thousands
Answer: (a) 45 ThousandsSolution: Total income of family C on January, $$ = 20 + 25 $$ $$ = 45 \ Thousands $$
- What is the difference between income of family C on Fabruary to the income of family B on January?
- 5 Thousands
- 10 Thousands
- 15 Thousands
- 20 Thousands
Answer: (d) 20 ThousandsSolution: Required difference, $$ = 50 - 30 $$ $$ = 20 \ Thousands $$
- What is the respective ratio between the income of family B on Fabruary, March and April?
- 7:8:9
- 9:8:7
- 8:9:7
- 9:7:8
Answer: (c) 8:9:7Solution: Required ratio, $$ = 40 : 45 : 35 $$ $$ = 8 : 9 : 7 $$