Bar Diagrams: Exercise-1
Overview:
| Questions and Answers Type: | MCQ (Multiple Choice Questions). |
| Main Topic: | Data Interpretation. |
| Data Interpretation Sub-topic: | Bar Graph Questions and Answers. |
| Number of Questions: | 5 Questions with Solutions. |
Directions: In the following bar diagram, the number of history books and geography books sold by six different book sellers in a certain time has been given. Study the bar diagram carefully to answer the questions.
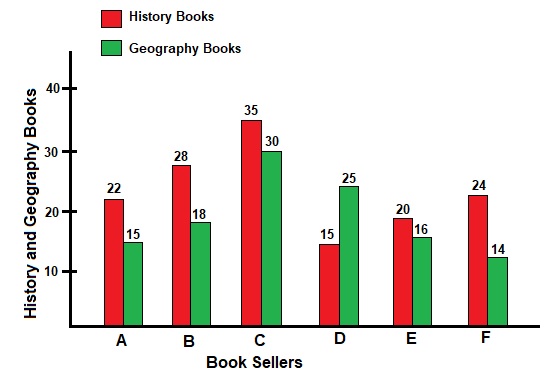
- What is the average number of history books sold by all book sellers taken together?
- 20
- 22
- 24
- 26
Answer: (c) 24Solution: Total number of books sold by all book sellers = 144 Total number of book sellers = 6, then $$ Average = \frac{144}{6} $$ $$ = 24 \ Books $$
- By what percent the number of history books sold by book seller E is more than that of book seller D?
- 22.22%
- 33.33%
- 44.44%
- 55.55%
Answer: (b) 33.33%Solution: Required percent, $$ = \frac{20 - 15}{15} \times 100 $$ $$ = \frac{100}{3} = 33.33 \ \% $$
- What is the average of the number of geography books sold by book sellers B, C and F together?
- 20.7
- 25.2
- 32.5
- 35.3
Answer: (a) 20.7Solution: Total number of geography books sold by B, C and F together = 62 Number of book sellers = 3 (B, C and F), then $$ Average = \frac{62}{3} $$ $$ = 20.7 \ Books $$
- What is the respective ratio between the number of history books sold by book seller D and that of geography books sold by book seller C?
- 1:1
- 1:2
- 2:1
- 3:2
Answer: (b) 1:2Solution: Required ratio, $$ = 15 : 30 $$ $$ = 1 : 2 $$
- What is the respective ratio of the numbers of geography books sold by book seller A and book seller D?
- 1:3
- 2:1
- 5:2
- 3:5
Answer: (d) 3:5Solution: Required ratio, $$ = 15 : 25 $$ $$ = 3 : 5 $$