Bar Diagrams: Exercise-3
Overview:
| Questions and Answers Type: | MCQ (Multiple Choice Questions). |
| Main Topic: | Data Interpretation. |
| Data Interpretation Sub-topic: | Bar Graph Questions and Answers. |
| Number of Questions: | 5 Questions with Solutions. |
Directions: In the following bar diagram, the number of Refrigerators and Televisions (in millions) sold by six different companies in a certain year has been given, study the bar diagram carefully and answer the questions given below it.
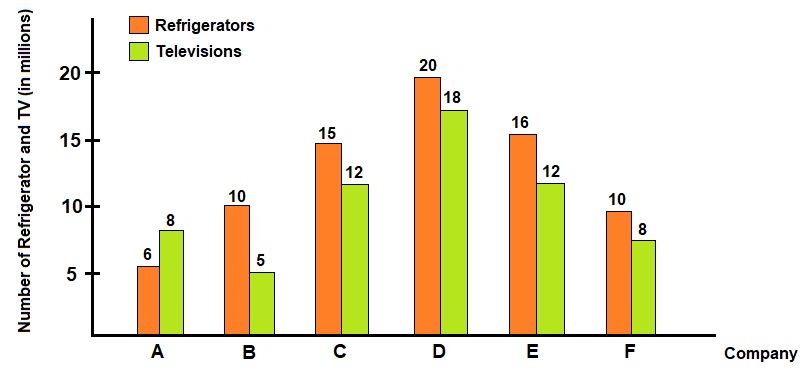
- What is the average number of Refrigerators sold by all companies taken together in a year?
- 10.25 million
- 12.83 million
- 16.62 million
- 17.12 million
Answer: (b) 12.83 millionSolution: Total number of Refrigerators sold by all companies together, $$ = 6 + 10 + 15 + 20 + 16 + 10 $$ $$ = 77 $$ Now the average, $$ = \frac{77}{6} = 12.83 \ million $$
- By what percent the number of Refrigerators sold by company E is more than that of company B?
- 40%
- 50%
- 60%
- 70%
Answer: (c) 60%Solution: Required percentage, $$ = \frac{16 - 10}{10} \times 100 $$ $$ = 60 \ \% $$
- What is the average of the number of Televisions sold by B, C and D together?
- 11.66 million
- 13.58 million
- 15.22 million
- 19.32 million
Answer: (a) 11.66 millionSolution: Average number of Televisions sold by companies B, C and D together, $$ = \frac{5 + 12 + 18}{3} $$ $$ = 11.66 \ million $$
- What is the respective ratio between the number of Refrigerators sold by company B and that of Televisions sold by company C?
- 2:3
- 3:5
- 5:6
- 6:7
Answer: (c) 5:6Solution: Required Ratio, $$ = 10 : 12 $$ $$ = 5 : 6 $$
- What is the respective ratio of the number of Televisions sold by company C and D?
- 2:3
- 3:4
- 4:5
- 5:6
Answer: (a) 2:3Solution: Required Ratio, $$ = 12 : 18 $$ $$ = 2 : 3 $$