Logical Venn Diagrams: Introduction
Venn diagrams are just a pictorial way to solve such questions easily. The pictures of Venn diagrams can be represented in the form of circle, triangle, square etc. but the logic of the diagram will remain unchanged. some of the Venn diagrams are given below to understand the meaning of pictures.
(1) If there are two pictures represents A and B then
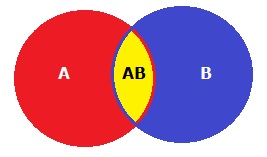
(a) Red colour region represents A only.
(b) Blue colour region represents B only.
(c) Yellow colour region represents both A and B.
(2) If there are three pictures represents A, B and C then
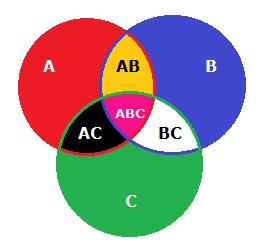
(a) Red colour region represents A only.
(b) Blue colour region represents B only.
(c) Green colour region represents C only.
(d) Black colour region represents both A and C.
(e) White colour region represents both B and C.
(f) Yellow colour region represents both A and B.
(g) Pink colour region represents A, B and C.
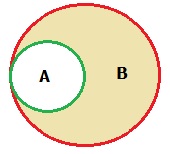
(3) There are two pictures represents A and B. If the statement says "Some A are B" then the final possible Venn diagram will be drawn as,
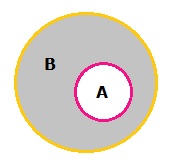
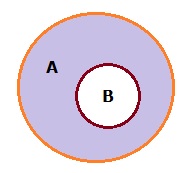
(3) There are two pictures represents A and B. If the statement says "All A are B" then the final possible Venn diagram will be drawn as,
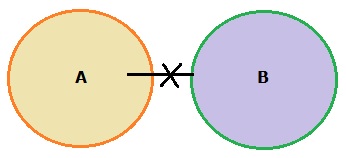
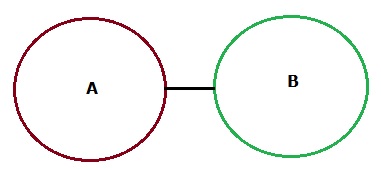
(3) There are two pictures represents A and B. If the statement says "No A are B" then the final possible Venn diagram will be drawn as,
(3) There are two pictures represents A and B. If the statement says "Some A are not B" then the final possible Venn diagram will be drawn as,